
Is this flood normal for the season?
Floodplains fill and recede. Rivers expand with the season. A water-covered pixel can be part of a recurring pattern, or a departure from it. Interpreting a flood observation starts with knowing that history.
Analysts need to know what “normal” water looks like at each time of year, on exactly the same grid and 10-day calendar as the satellite flood maps they are reading. VISTA provides that reference.
What was seen, and what is normal
Dated archives combine daily satellite observations into one map per 10-day period (dekad), leaving fewer cloud gaps and keeping the largest flood extent seen. Multi-year baselines stack the same period across every year since 2012 to show what is normal. Both come in dekadal and rolling monthly versions.
When does this place usually flood?
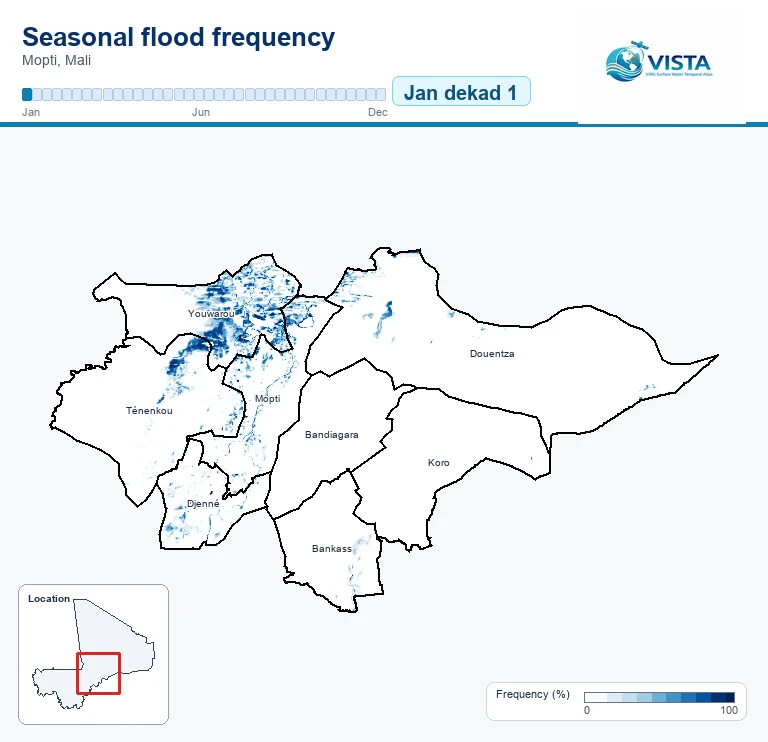
Watch the historical pattern of flooding change through the year. Each animation cycles through 36 dekads from January to December: three periods per month.
Read the blue
The 0–100% scale shows the share of valid historical years with any flooding at each pixel for that dekad. Darker blue means flooding was more frequent.
For example, 80% means flooding in 8 out of 10 valid years for that period.
A calendar of historical seasonality, not observations from a specific year.
freq_flood_anyCount
In how many years was flooding seen here at this time of year?
Also records in how many years the satellite could actually see the ground, so you can judge how much evidence lies behind each statistic.
Frequency
In what share of clear-sky years was this place flooded?
Flooded observations divided by valid observations for the same period of the year, so places with different cloud cover can be compared.
Dominant class
What is this place usually at this time of year?
Dry land, permanent water, flooded or cloud-covered: the state seen most often across years, with all flood levels grouped together.
How VISTA is made / A time-enabled data cube
From satellite maps to a seasonal baseline
Every map describes the same spatial grid at a different time. Stack the dated maps along time, then gather the same period across years. Repeat for all 36 dekads to build a calendar of baselines.
A calendar of image stacks
Maps of the same place arrive across years. Each joins its matching dekad: three periods per month, 36 stacks per year.
Each tiny map has the same x–y grid. Stacking maps along time creates the data cube.
36 periods. 36 frequency layers.
For every stack, calculate how often each pixel was flooded among its valid observations.
Darker purple means more frequent flooding. This example is wettest in September–December and driest in March.
Turn a matching baseline into a mask
For a late-January event, take the late-January baseline. Pixels at or above the selected frequency become the seasonal-water mask.
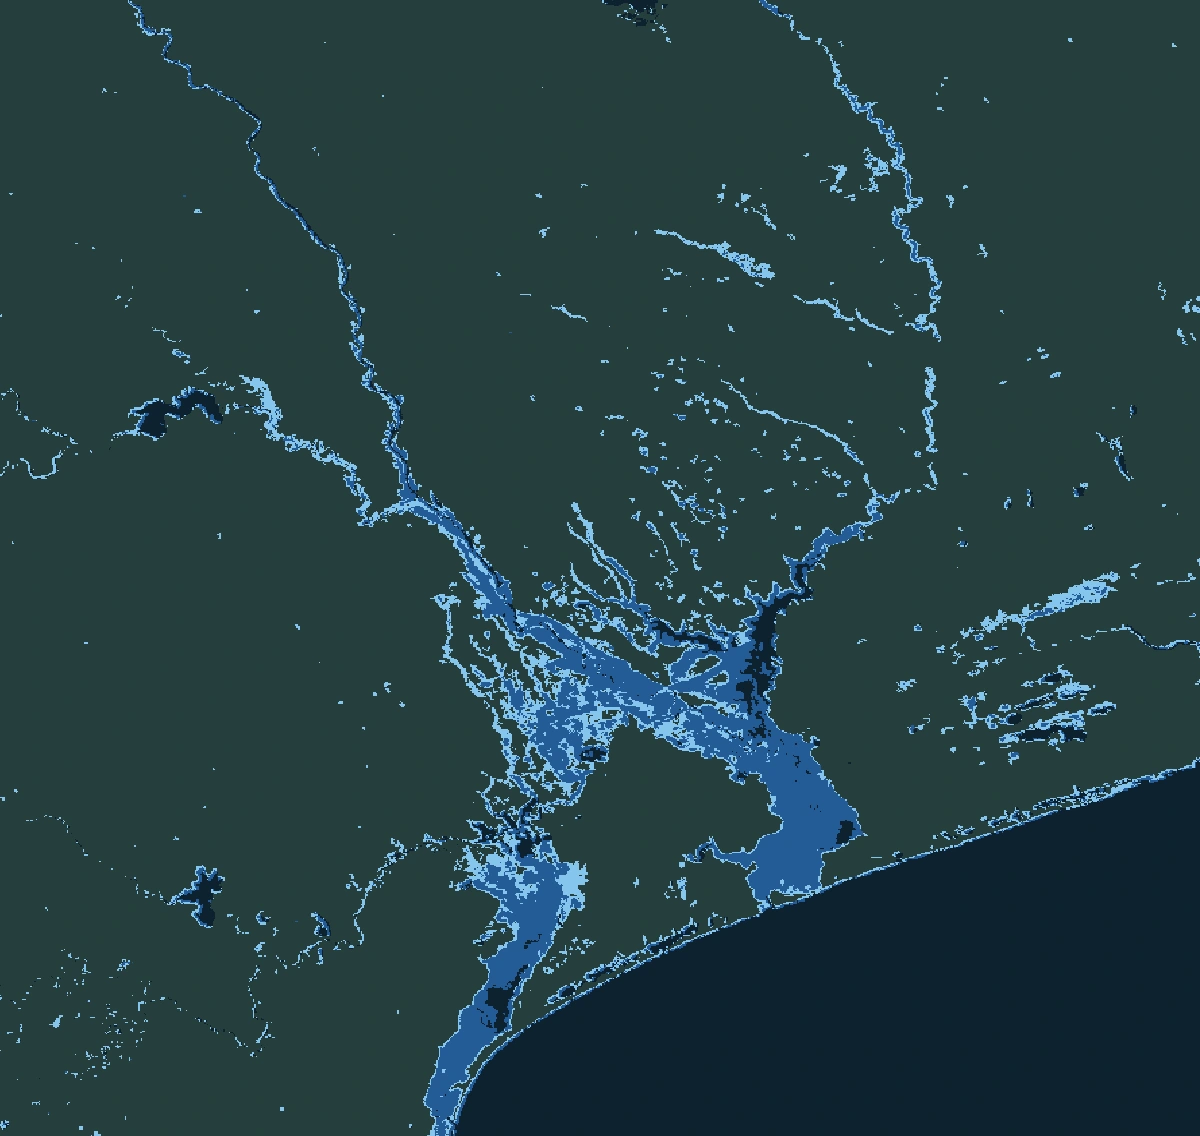
Seasonal floods removed by the maskPixels covered by water now that were also flooded in the same period in at least 30% of valid historical observations.
Reveal water outside the seasonal pattern
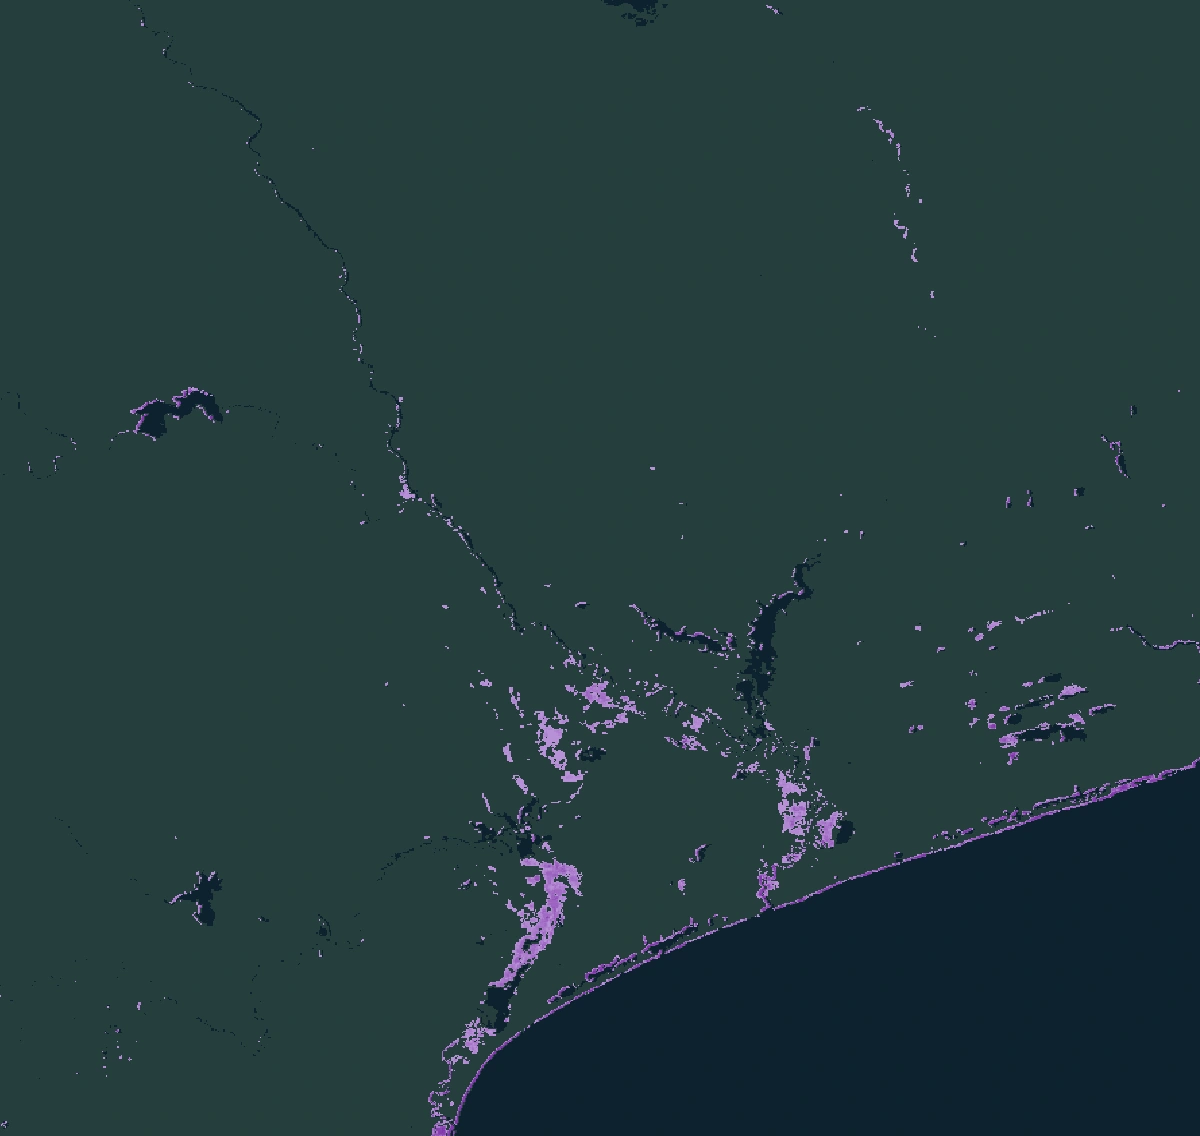
Apply that mask to a recent flood observation of the same period. Remove seasonal water; keep exceptional waters in amber.
Observed floodwater + valid baseline + frequency below threshold
Exceptional floodsPixels covered by water now that were flooded in the same period in less than 30% of valid historical observations.
Seasonal water is removed from the observation using the selected threshold.
VISTA’s record spans 2012–2026 with varying valid support. Dekadal baselines match one dekad; rolling monthly baselines match a centred three-dekad window. “Exceptional” follows the selected rule, not a universal classification.
VISTA reorganises VIIRS flood maps produced by NOAA and George Mason University, and inherits their limits. Cloud reduces the evidence behind each statistic, and thresholds are an analytical choice. Read the interpretation guidance ↗
Explore, download or analyse VISTA
Choose the route that fits your work.
-
Interactive maps
VISTA Explorer
Explore historical flood patterns and compare an observed period with its seasonal baseline in your browser. No code or account needed.
Launch VISTA Explorer (opens in a new tab)About VISTA Explorer → -
Files for GIS
GeoTIFF downloads
Browse dated observations and seasonal baselines. Download Cloud Optimized GeoTIFFs from the public bucket. No account needed.
Browse GeoTIFFs -
Scripted analysis
Earth Engine Code Editor
Load VISTA assets in your own analysis or start with a worked flood example. The Code Editor requires an Earth Engine account.
See Earth Engine examples -
QGIS & Python
FAO STAC catalogue
Open flood-frequency baselines directly in QGIS or read a region with Python. Dekadal and rolling monthly frequency only. No account needed.
Use VISTA through STAC
Find band definitions and naming conventions in the user guide.
Choose a seasonal baseline.
Choose a point in the annual cycle, then select a dekadal or rolling monthly baseline and the metric you need. VISTA will take you to the matching GeoTIFFs, Earth Engine code and product documentation.
File key 01d2 (month + dekad) · One recurring dekad
Get your selected baseline
Download GeoTIFFs or use the matching baseline in Earth Engine for your selected period and metric.
Download GeoTIFFs
You’ll confirm attribution before downloading.
Use the selected baseline as a global asset in Earth Engine
Copy the script, open the Code Editor, paste it and select Run. An Earth Engine account is required.
Asset ID
Show script with legend
Count and frequency scripts display flood-any values; the product includes all its bands.
VISTA applied to real flood events.
Each case compares a dated VISTA observation with the multi-year baseline for the same dekad, then keeps only the floodwater where flooding is historically rare. Choose a case: only the area and the dekad change, the method stays the same.
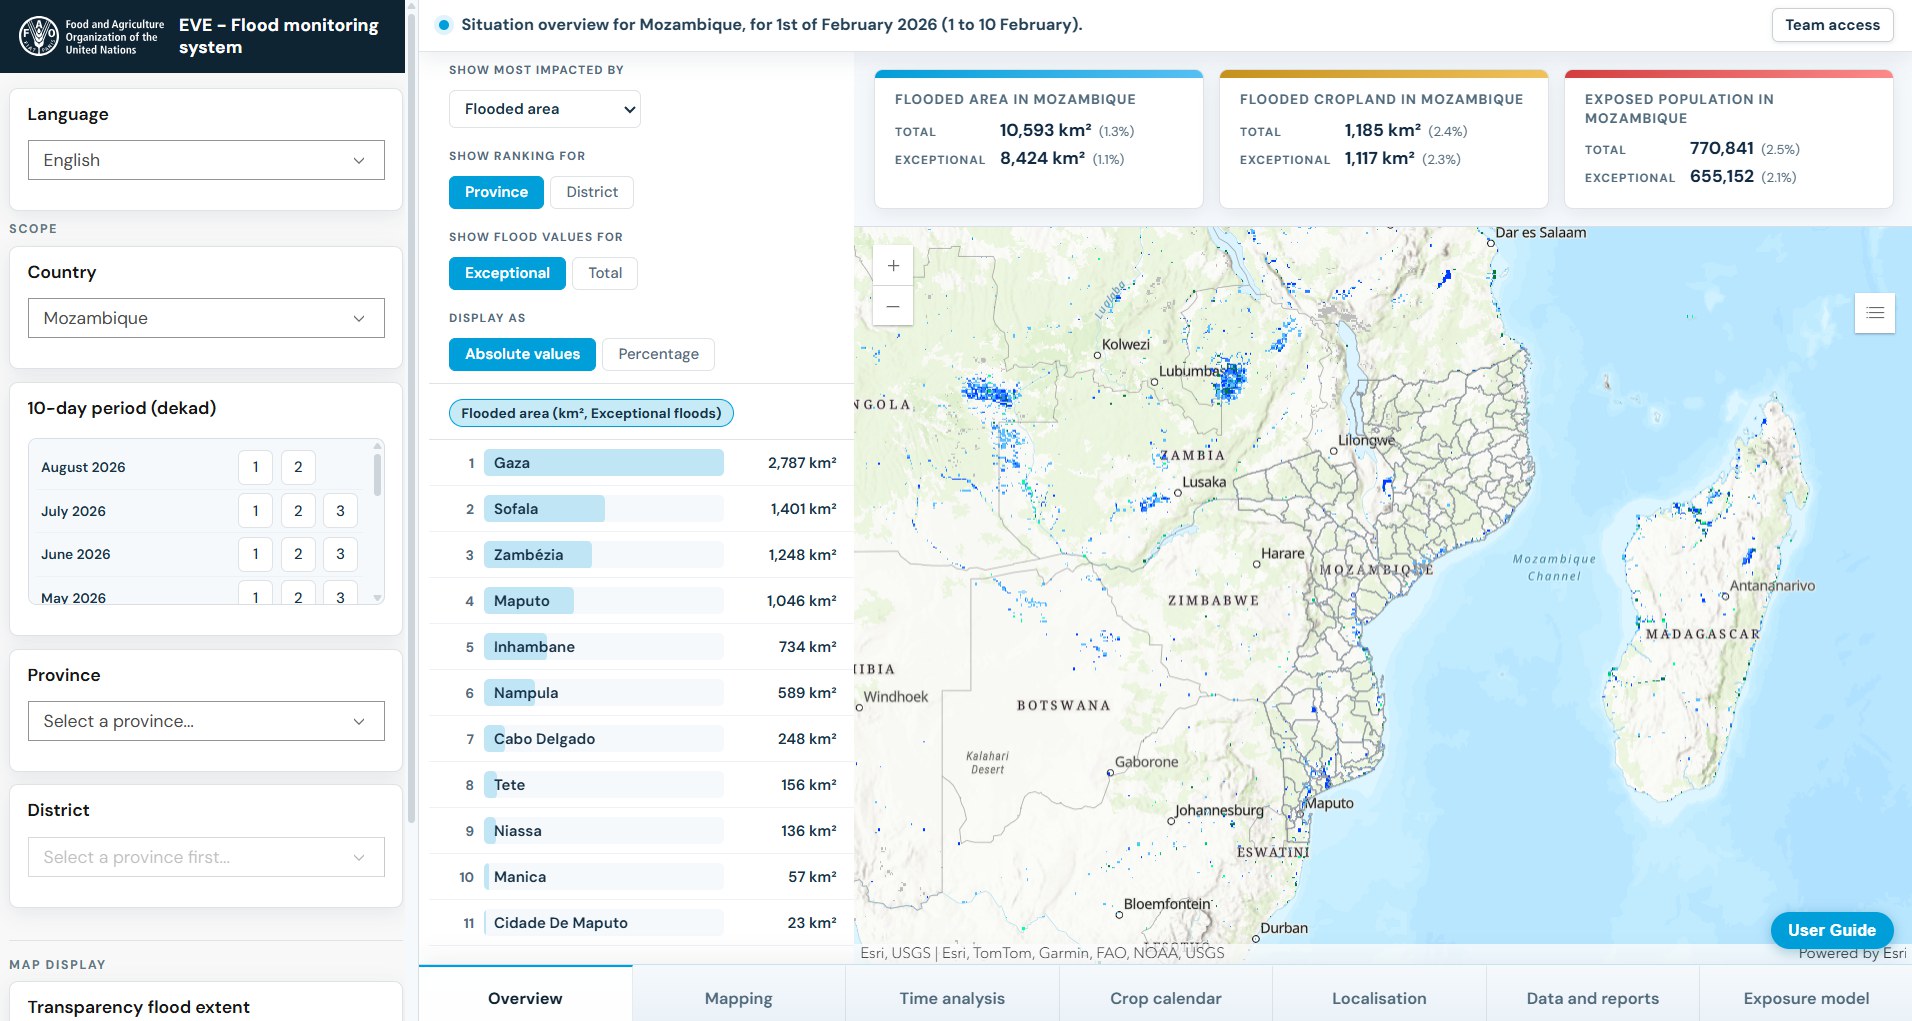
Sofala floods, Mozambique
Floodwater observed across Sofala province in late January 2026, set against how often the same places flooded in this dekad across the VISTA record.
- Area
- Sofala province, Mozambique
- Dekad
- 21–31 January 2026 · 202601d3
- Baseline
- 3rd dekad of January · 01d3
Run the script, then tick the baseline and the exceptional-flood layer in its Layers panel.
// VISTA in Google Earth Engine
// Sofala province, Mozambique · dekad 202601d3 (21–31 January 2026)
// Paste into https://code.earthengine.google.com and press Run.
// Observed floods are drawn in blues so the orange exceptional-flood layer stands out on top.

var sofala = ee.FeatureCollection('FAO/GAUL/2025/level1')
  .filter(ee.Filter.eq('GAUL0_NAME', 'Mozambique'))
  .filter(ee.Filter.eq('GAUL1_NAME', 'Sofala'));

// 1. Dated observation: dekadal archive, one class band (0–11)
var observed = ee.Image(
  'projects/fao-oer/assets/vista_dekadal_archive/vista_dekad_202601d3'
).select(0);

// 2. Multi-year baseline for the same dekad of the year (01d3):
//    share of valid years with any flood class, 0–1
var baseline = ee.Image(
  'projects/fao-oer/assets/vista_products/dekadal/frequency/vista_frequency_01d3'
).select('freq_flood_any');
// Rolling monthly baseline centred on 01d3, as used by EVE:
// 'projects/fao-oer/assets/vista_products/monthly/frequency/vista_frequency_monthly_01d3'

// 3. Exceptional flood: observed flood where the baseline is below a threshold you choose
var threshold = 0.30;
var thresholdLabel = (threshold * 100) + '%';
var flood = observed.gte(1).and(observed.lte(3));
var exceptional = flood.and(baseline.lt(threshold)).selfMask();

// Archive class colours (values 7 and 8 unused). Flood classes 1–3 run from light to dark
// blue; permanent water is teal so it does not read as flooding.
var archiveVis = {min: 0, max: 11, palette: [
  'eeeeee', '9ecae1', '4292c6', '08306b', 'fdeef5', 'b3f0ff',
  '40d4e8', 'cccccc', 'cccccc', 'cccccc', 'a67c52', '2a9d8f'
]};
// Flood-any frequency ramp and the orange exceptional-flood colour
var frequencyPalette = ['ffffff', 'd9b3ff', '7a0177'];
var exceptionalColour = 'e6550d';

// Only the observed classes and the boundary are shown at start.
Map.centerObject(sofala, 7);
var observedLayer = Map.addLayer(observed.clip(sofala), archiveVis,
  'Observed classes, 21–31 Jan 2026', true);
var baselineLayer = Map.addLayer(baseline.selfMask().clip(sofala),
  {min: 0, max: 1, palette: frequencyPalette},
  'VISTA flood frequency baseline, 3rd dekad of January', false);
var exceptionalLayer = Map.addLayer(exceptional.clip(sofala), {palette: [exceptionalColour]},
  'Exceptional flood, VISTA baseline below ' + thresholdLabel, false);
var boundaryLayer = Map.addLayer(ee.Image().byte().paint(sofala, 1, 2),
  {palette: ['0b2029']}, 'Sofala boundary', true);

// Layer panel that stays open: the built-in Layers list cannot be pinned open,
// so it is hidden and replaced by this one.
Map.setControlVisibility({layerList: false});
var layerPanel = ui.Panel({style: {position: 'top-right', padding: '8px', width: '280px'}});
layerPanel.add(ui.Label('Layers', {fontWeight: 'bold'}));
layerPanel.add(ui.Label(
  'Start with what VISTA observed on 21–31 January 2026. ' +
  'Then tick the baseline to see how often each place usually floods in this dekad, ' +
  'and slide its opacity to compare it with the observation. ' +
  'Finally tick the exceptional flood layer: it keeps only the floods where the ' +
  'baseline is below ' + thresholdLabel + ', meaning flooding there is unusual for this time of year.',
  {fontSize: '12px', color: '#444', margin: '0 0 8px 0', whiteSpace: 'pre-wrap'}));
function layerControl(layer, withOpacity) {
  layerPanel.add(ui.Checkbox({
    label: layer.getName(),
    value: layer.getShown(),
    onChange: function(shown) { layer.setShown(shown); },
    style: {margin: '2px 0 0 0'}
  }));
  if (withOpacity) {
    layerPanel.add(ui.Slider({
      min: 0, max: 1, value: 1, step: 0.05,
      onChange: function(value) { layer.setOpacity(value); },
      style: {stretch: 'horizontal', margin: '0 0 6px 20px'}
    }));
  }
}
// Listed in reading order: observation, reference, result, then the boundary
layerControl(observedLayer, true);
layerControl(baselineLayer, true);
layerControl(exceptionalLayer, true);
layerControl(boundaryLayer, false);
Map.add(layerPanel);

// Legends for the observation, frequency and exceptional-flood layers.
var legend = ui.Panel({style: {position: 'bottom-left', padding: '10px', width: '280px'}});
legend.add(ui.Label('VISTA · layer legends', {fontWeight: 'bold'}));
function legendRow(colour, label) {
  legend.add(ui.Panel([
    ui.Label('', {backgroundColor: '#' + colour, padding: '8px', margin: '2px 6px 2px 0', border: '1px solid #888'}),
    ui.Label(label)
  ], ui.Panel.Layout.flow('horizontal')));
}
legend.add(ui.Label('Observation classes (21–31 January 2026)', {fontWeight: 'bold'}));
// Snow and ice classes (4–6) do not occur in these flood cases, so they are not listed.
var classValues = [0,1,2,3,9,10,11];
var classNames = ['No data','Flood: 1–49% water','Flood: 50–79% water','Flood: 80–100% water','Cloud','Land','Permanent water'];
classValues.forEach(function(value, i) { legendRow(archiveVis.palette[value], classNames[i]); });
legend.add(ui.Label('VISTA flood frequency baseline, 3rd dekad of January', {fontWeight: 'bold'}));
var frequencyRamp = ee.Image.pixelLonLat().select('longitude');
legend.add(ui.Thumbnail({image: frequencyRamp.visualize({min:0, max:1, palette: frequencyPalette}), params:{bbox:[0,0,1,0.1], dimensions:'240x18'}, style:{height:'18px', stretch:'horizontal'}}));
legend.add(ui.Label('0%                                      100%'));
legendRow(exceptionalColour, 'Exceptional flood, VISTA baseline below ' + thresholdLabel);
legendRow('0b2029', 'Sofala boundary');
legend.add(ui.Label('Threshold is an analytical choice.'));
Map.add(legend);
The 30% threshold is illustrative, not a VISTA classification. Running the script requires an Earth Engine account.
Asset ID patterns
An asset ID is a folder plus an image name. Dated archives use the key YYYYMMdD: 202601d3 is 21–31 January 2026. Multi-year products use MMdD: 01d3 is the third dekad of January across all years.
- Dekadal archive ↗
projects/fao-oer/assets/vista_dekadal_archive/vista_dekad_202601d3- Rolling monthly archive ↗
projects/fao-oer/assets/vista_monthly_archive/vista_monthly_202601d3- Dekadal statistics ↗
projects/fao-oer/assets/vista_products/dekadal/frequency/vista_frequency_01d3Alsocount/vista_count_01d3anddominant_class/vista_dominant_class_01d3- Monthly statistics ↗
projects/fao-oer/assets/vista_products/monthly/frequency/vista_frequency_monthly_01d3Alsocount/vista_count_monthly_01d3anddominant_class/vista_dominant_class_monthly_01d3
Each layer is one global asset. Folder pages in the Code Editor may not list every image: build the ID from the pattern, or find the file name in the GeoTIFF browser. Band schemas are in the user guide.
The record, in numbers.
Inventory dated 6 October 2026.
Coverage: 21 January 2012 to 30 April 2026.
- GeoTIFF objects
- 7,584
- Dekads represented
- 500 / 514
- Approximate size
- 0.97 TB
Coverage, gaps and release inventory
The inventory contains 500 of 514 nominal dekadal periods. The 14 absent periods are listed below and are not gap-filled. An available raster does not imply every source pixel or composite was observed.
201203d3 201411d1 201411d2 201411d3 201412d1 201412d2 201412d3 201601d1 201601d2 202108d1 202109d2 202211d2 202306d3 202407d1
The inventory provides per-object paths, size, timestamps and checksums. Annual updates are intended, subject to resources; this is a historical record rather than a live alert feed.
Download this inventory snapshot ↓Open data, open code, open to feedback
VISTA is shared infrastructure for science and humanitarian action. We believe a global record like this becomes more valuable when researchers, analysts and responders can examine it, challenge it and build on it. That is why the complete dataset is free to access and reuse under CC BY 4.0, and the code that builds it from the VIIRS flood products is public under MIT, so anyone can reproduce the atlas.
Your experience can improve the atlas. We welcome feedback on data quality, metadata, documentation and accessibility, as well as methods, use cases and contributions that can help VISTA serve more people and places.
Cite the data you use.
Suggested dataset acknowledgement. Include the product and period used, and your access date.
Food and Agriculture Organization of the United Nations (FAO) and European Commission Joint Research Centre (JRC). VISTA (VIIRS Surface Water Temporal Atlas). Flood and surface-water archives and multi-year baselines, 2012–2026. Publication inventory snapshot: 6 October 2026. Data licensed under CC BY 4.0. Accessed [date]; product(s) and period(s): [specify].
Open data.
Clear attribution.
Data — CC BY 4.0
Reuse and adapt with attribution under the Creative Commons Attribution licence ↗.
Processing code — MIT
The full pipeline that builds VISTA from the VIIRS flood products is public, so the atlas can be reproduced, checked and extended. View the code on GitHub ↗
The source VIIRS flood products are credited to NOAA and George Mason University. Please retain source attribution in derived work.
A joint effort across humanitarian and science teams
Developed jointly by FAO and the JRC with six contributing institutions, through in-kind staff time, bringing humanitarian analysis, research and operational satellite science together.
Coordinated by


Contributing institutions





Source data NOAA and George Mason University’s VIIRS flood products.
Infrastructure
The VISTA scientific group & additional contributions
- Andrea Amparore Food and Agriculture Organization of the United Nations
- Francesco Collivignarelli European Commission Joint Research Centre
- Albert Kettner Dartmouth Flood Observatory
- William Straka SSEC, University of Wisconsin–Madison
- Antara Dasgupta RWTH Aachen University
- Guy Schumann RSS-Hydro
- Giancarlo Pini World Food Programme
- Andrew Kruczkiewicz Columbia University
- Edoardo Forzano Food and Agriculture Organization of the United Nations
- Josef Clifford Food and Agriculture Organization of the United Nations
Additional contributions from Josefine Brückmann (UCLouvain). Affiliations identify individual contributors; they do not imply institutional consortium membership.
05 / In use · FAO Data in Emergencies
Not just a dataset.
An operational FAO baseline.
Events Visualization in Emergencies (EVE) uses VISTA’s rolling monthly flood-frequency baseline to separate seasonally expected flooding from exceptional flooding, then combines flood observations with population, cropland and other exposure layers.
EVE uses freq_flood_any ≥ 0.25 as its configured seasonal rule. That threshold belongs to EVE’s analysis; it is not a universal VISTA recommendation.